How to Measure AI Success in Manufacturing: The Framework Every CEO Gets Wrong
56% of CEOs report zero revenue increase or cost reduction from AI in the last 12 months. Most of them are measuring the wrong things — or measuring the right things at the wrong time. Here is the framework that actually tells you whether your AI is working.
Direct answer: How do you measure AI success in manufacturing?
You measure AI success in manufacturing at three levels, in sequence: use-case level first (not programme level), quality metrics before quantity metrics, and behavioural adoption as the ultimate signal before financial ROI. The CEO who waits for a clean P&L number before declaring success will almost always either declare failure too early or celebrate activity that has no real impact. The right framework is: define the metrics for each specific use case before it is built, measure quality in the first 60–90 days, shift to quantity once quality is above threshold, and watch for the behaviour signal — when the tool becomes what people reach for first, automatically, without being told. That is when the financial outcome becomes inevitable.
56%
of CEOs report neither increased revenue nor decreased costs from AI in the last 12 months. Only 12% report achieving both.
The 12% who achieve both share a specific measurement behaviour: they define success metrics before deployment, track use-case-level outcomes rather than programme-level dashboards, and separate AI-attributable impact from other business changes occurring simultaneously. The 56% who achieve neither are almost entirely the ones measuring login activity, hours saved, and tasks automated — not commercial outcomes.
Source: PwC 2026 CEO Survey via Forbes
Why Most CEOs Are Measuring AI Success Wrong
There are three measurement traps that catch almost every manufacturing CEO who has invested in AI. Each one feels like measurement. None of them tell you whether the AI is actually creating value.
Trap 1 — Measuring adoption as a proxy for value
‘The system is being used’ is the most commonly cited AI success signal in manufacturing boardrooms. It is a necessary condition for AI success — but it is not a sufficient one. A system can have strong adoption and still produce no commercial outcome if the use case was wrong to begin with, if the quality of AI outputs is not above a threshold the team can trust, or if adoption has not scaled to the people and decisions that actually move the P&L.
The right success chain is not just adoption. It is: Right use case — Right quality — Right quantity — Right adoption at scale. Each step depends on the previous one. Strong adoption of the wrong use case is not success. Excellent quality in a system nobody uses is not success. The chain must be complete.
Trap 2 — Measuring visibility as a proxy for impact
The dashboard is live. The vendor shows beautiful charts. The management team can see real-time data for the first time. Nobody is acting on it differently. This is the visibility trap — confusing the presence of information with the use of information. A procurement dashboard that nobody consults before placing an order is not a procurement intelligence system. It is an expensive reporting tool.
Trap 3 — Measuring time saved as a proxy for P&L impact
‘We saved 25 hours per week of manual data entry.’ This is a real outcome. It is not an AI success metric unless those 25 hours are being used for something that produces more value than the data entry did. Time saved is a leading indicator, not a result. The result is what happens with the recovered time — and in most manufacturing organisations, recovered time either disappears into other low-value work or produces genuine commercial output. Measuring which outcome is happening is the CEO’s measurement job.
Organisations that measure AI ROI by counting users or sessions consistently report lower returns than those measuring operational outcomes.
The measurement approach determines the outcome — not because measuring differently changes what the AI does, but because measuring the right things forces the organisation to design the use case correctly from the start. A team that knows they will be measured on procurement cost change designs the AI system around procurement decisions. A team that knows they will be measured on system logins designs for engagement. You get what you measure.
Source: NVIDIA 2026 State of AI Report via aiassemblylines.com
The Right Framework: Three Levels, Three Phases, One Sequence
The framework that actually works has three components — and they must be applied in the right order. This same sequencing discipline underpins any effective AI implementation roadmap for manufacturing teams.
Level 1 — Define metrics at the use case level, not the programme level
A CEO who asks ‘how is our AI programme doing?’ is asking the wrong question. A CEO who asks ‘how is the procurement intelligence system performing on average purchase cost this month versus last month?’ is asking the right question. Each use case has its own P&L line, its own measurement horizon, and its own success threshold. Programme-level metrics — AI spend, number of systems deployed, user count — are management reporting, not success measurement.
Before any AI use case is built, three questions must be answered: which specific P&L line will this move, by how much, and by when? If the answers are not specific — if ‘it will improve efficiency’ is the best the team can offer — the use case is not ready to build. The measurement framework is designed before the system is built, not retrofitted after it is live.
Level 2 — Three phases of measurement for every use case
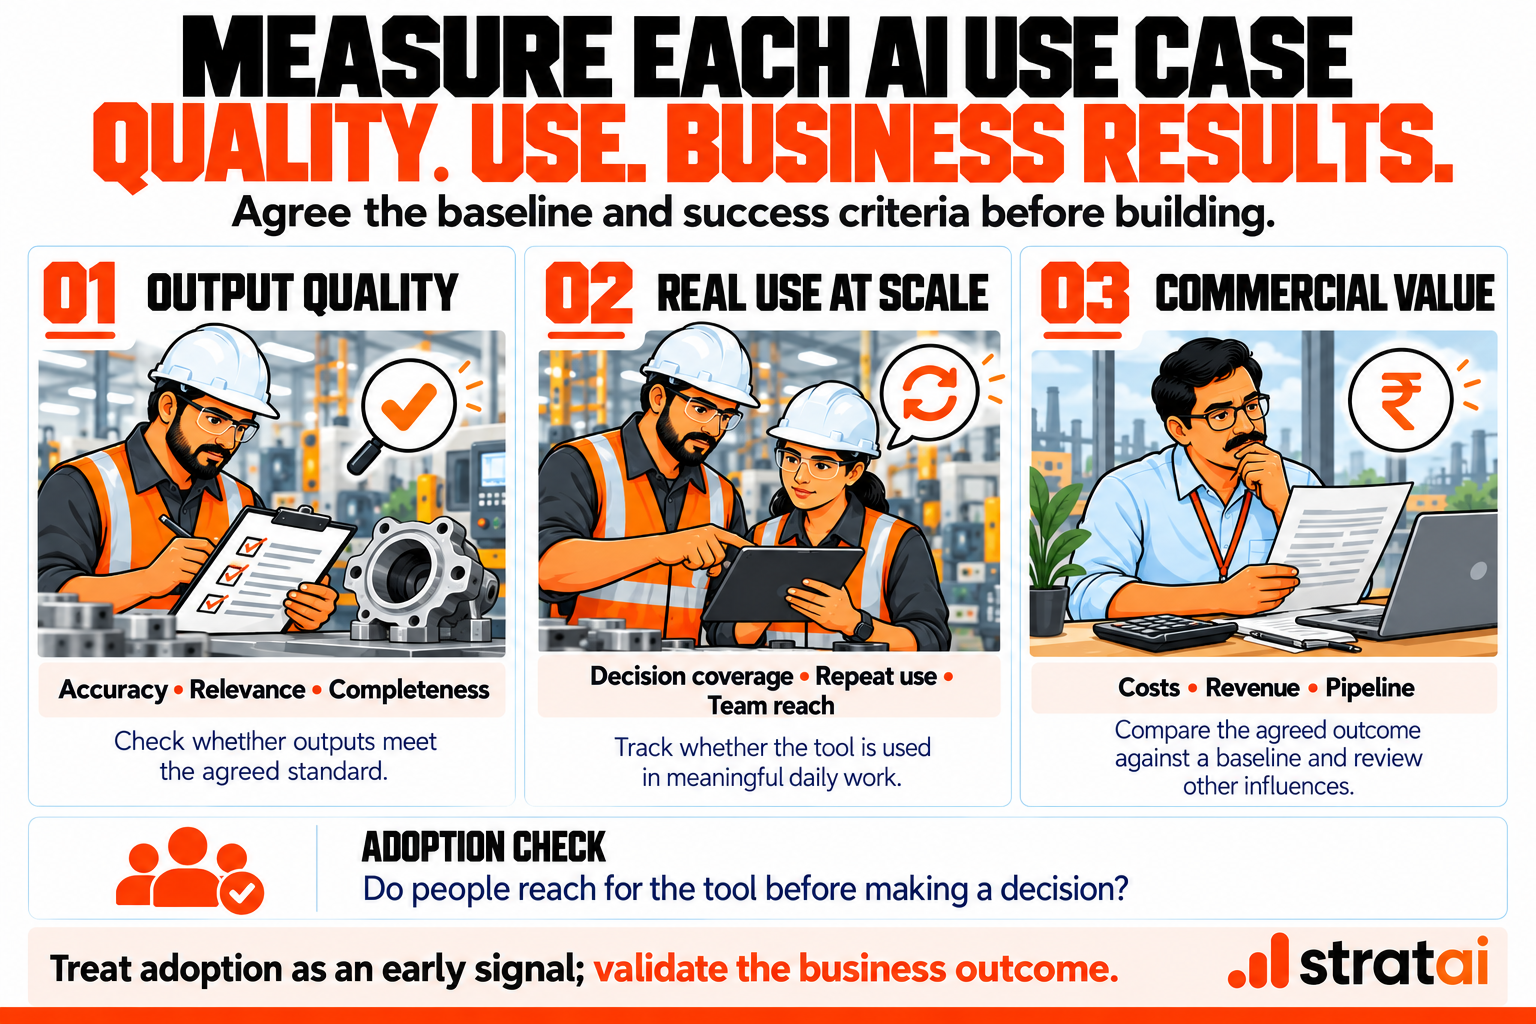
Every AI use case goes through three measurement phases. The metrics that matter in Phase 1 are not the metrics that matter in Phase 3. Applying Phase 3 metrics in Phase 1 produces false negatives — the system looks like it is failing when it is actually learning.
| Phase | Focus | Metric type | What to track |
|---|---|---|---|
| Phase 1 | Quality | Is it working correctly? | Accuracy of outputs, error rate, relevance of recommendations, data completeness. Is the AI producing outputs the team can trust? If quality is below threshold, do not scale. |
| Phase 2 | Quantity | Is it being used at scale? | Volume of decisions made with AI input, frequency of use, coverage across relevant team members. Quantity metrics only matter after quality is above threshold. |
| Phase 3 | Commercial | Is it moving the P&L? | The specific financial metric defined before the use case was built. Average purchase cost, meetings booked, defect rate, time to quote, project pipeline value. This is the only metric the board should see. |
Level 3 — Behavioural adoption as the ultimate signal
Before the P&L number moves, there is a signal that matters more: whether the tool has become default behaviour. When the purchase decision-maker opens the AI system before placing an order — automatically, without being prompted — the commercial outcome is already determined. When the architect uses the fabric catalogue for every project brief as a matter of habit — not because they were told to, but because it is simply faster and better — the pipeline value will follow.
The behavioural signal matters because P&L attribution in manufacturing is genuinely difficult. Commodity price volatility, geopolitical events, customer mix changes, and seasonal demand fluctuations all affect the numbers simultaneously. A procurement tool that is producing better decisions in a year when commodity prices spike will not show in the purchase cost line — but the management team knows the tool is invaluable because they cannot imagine making that decision without it. That confidence is not a soft metric. It is the most important signal the CEO has.
Three Real Use Cases — How Measurement Looks in Practice
USE CASE 01 · AI-Powered B2B Outbound — Listed Cotton Manufacturer
The goal: more meetings with the right B2B customer personas in target export markets. The measurement framework, applied in sequence — Phase 1 quality metrics: ICP match rate (are we reaching the right persona?), open rate (is the messaging landing?), response rate (is there interest from relevant buyers?). These are measured for the first 60–90 days. No judgement on quantity until quality is confirmed above threshold. Phase 2 quantity metrics: number of relevant meetings booked and completed. Early deployment result: 6 confirmed appointments in Indonesia within 2 weeks. Phase 3 commercial metric: pipeline value from AI-sourced meetings, conversion rate, customer acquisition cost. The VP of Marketing described it simply: the system did in two weeks what the team had been trying to do manually for months — the difference was not effort but precision. The metric that matters at scale: are we acquiring better customers at lower cost than before?
FIELD EXAMPLE · Listed Cotton Manufacturer — B2B Outbound AI
Phase 1 quality: ICP match rate, open rate, response rate from relevant buyers — measured for first 60-90 days, no scale-up until confirmed above threshold. Phase 2 quantity: meetings booked and completed. Early result: 6 confirmed appointments in Indonesia within 2 weeks of deployment. Phase 3 commercial: pipeline value from AI-sourced meetings, customer acquisition cost versus historical baseline.
USE CASE 02 · AI Fabric Catalogue — Symphony Furnishings
The goal: make a catalogue of over one lakh fabrics commercially accessible to architects. The measurement framework is sequential — each metric only becomes relevant once the previous one is above threshold. Stage 1: number of fabrics AI-digitised (is the catalogue complete?). Stage 2: number of architects trained on the tool (is the right audience aware?). Stage 3: number of architects with at least one appointment through the tool (is it driving behaviour?). Stage 4: number of architects repeating — coming back for a second, third, fourth project (is it creating habit?). Stage 5: number of projects sourced through the tool, and project value. The ultimate success metric: repeating architects. Repetition is the behaviour signal. Project value is the commercial outcome. Both must be present for the use case to be declared successful.
FIELD EXAMPLE · Symphony Furnishings — AI Catalogue
Stage 1: fabrics digitised. Stage 2: architects trained. Stage 3: architects with first appointment through the tool. Stage 4: repeating architects (the behaviour signal). Stage 5: projects sourced and project value (the commercial outcome). Repetition is the metric that proves the tool has become default behaviour — not just a one-time demonstration.
USE CASE 03 · Procurement Intelligence — Cotton Spinning Mill
This use case illustrates the most nuanced measurement challenge in manufacturing AI: when external volatility makes precise attribution impossible, behavioural adoption becomes the primary success signal. Designed metrics: average inventory levels, average purchase cost per unit, decision lag time (how quickly the purchase team acts on market signals). Reality: in a year with significant commodity price volatility driven by global events, both metrics are confounded. The purchase cost line moves — but is it the AI or the market? The right CEO response: watch the behaviour. If the purchase team consults the tool for every decision, if leadership references it in weekly reviews, if it has become the first thing opened before any procurement discussion — the tool is creating value. The exact quantum is unattributable. The value is not.
FIELD EXAMPLE · Cotton Spinning — Purchase Intelligence
Designed metrics: average inventory levels, average purchase cost per unit, decision lag time. Reality: commodity price volatility confounds both metrics in volatile years. Primary success signal used instead: behavioural adoption — does the purchase team consult the tool before every procurement decision, without being prompted? That behaviour, sustained across multiple commodity cycles, is the most reliable proxy for compounding value.
The principle great leaders apply
Great leaders identify high-ROI use cases, implement them, and make default behaviour the goal — not a precise ROI number. The obsession with exact attribution can kill genuinely valuable AI implementations. A tool that has become indispensable to the team’s daily work is creating compounding value that no single metric captures. The CEO who demands a clean P&L number before trusting the tool will almost always be wrong — either dismissing real value or approving false signals from cherry-picked data.
The Measurement Sequence — Summarised
Measure quality before you measure quantity. Measure quantity before you measure ROI. And measure behaviour before you measure anything else — because if it is not default behaviour, the ROI does not matter. Before starting measurement, verify your AI readiness — the right use cases to measure are the ones your organisation is actually ready to build.
29%
Only 29% of executives can measure AI ROI confidently. The 71% who cannot are almost entirely concentrated in the 95% failure rate category.
The measurement capability and the outcome are not coincidentally correlated. The organisations that define success metrics before deployment, track use-case-level outcomes, and separate AI-attributable impact from background noise are the same organisations that report positive ROI. Measurement discipline is not a reporting function — it is a design function. It shapes what gets built and how it gets built.
Source: Master of Code Research via aibusinessweekly.net
One critical note on AI as a component, not the whole solution
In every use case discussed above, AI is a core component of the solution — not the entire solution. The procurement intelligence system requires the AI tool AND a decision-making culture that consults it AND leadership that models its use. Without all three, the tool sits unused regardless of how accurately it predicts commodity movements. The architect catalogue requires the AI tool AND physical installation AND relationship building with architect firms AND a sales team that champions it. A technically perfect catalogue that architects have never been introduced to produces zero pipeline value. The outbound AI system for the cotton manufacturer requires the AI tool AND a VP who is willing to trust it AND an ICP definition sharp enough for the system to find the right buyers. Without the VP’s commitment, the system sends messages to nobody who matters.
The measurement framework must account for the non-AI components. When the commercial outcome does not appear on the timeline projected, the first question is not ‘is the AI working?’ It is: ‘are all the components of the solution in place?’ In most cases, the AI is performing as designed. The adjacent components — the behaviour change, the process redesign, the relationship building — are lagging. Fixing those is the CEO’s job. Blaming the AI is the wrong diagnosis.
The audit tells you which component is lagging — and what to fix first.
Tell us how you are currently measuring AI success in your plant.
→ Book your free half-day audit — no commitment, no strings
We review your current AI use cases, identify where your measurement framework is creating blind spots, and map the metrics that actually tell you whether your investment is working. We confirm your audit date within one business day.
Not sure if your AI use cases are the right ones to begin with? Take the 2-minute AI Readiness Assessment →
Frequently Asked Questions
How do you measure AI success in manufacturing?
You measure AI success in manufacturing at three levels in sequence: use-case level (not programme level), quality metrics before quantity metrics, and behavioural adoption before financial ROI. Define the specific P&L metric for each use case before it is built. Measure quality first — accuracy, relevance, error rate — for the first 60–90 days. Shift to quantity metrics only when quality is above threshold. The ultimate signal is behavioural: when the team reaches for the tool first, automatically, without being told. That behaviour change makes the financial outcome inevitable.
What metrics should a CEO track for AI in manufacturing?
At the use-case level, three categories of metric matter at different phases. Phase 1 (quality): accuracy of AI outputs, error rate, data completeness, relevance of recommendations. Phase 2 (quantity): volume of decisions made with AI input, frequency of use, coverage across the relevant team. Phase 3 (commercial): the specific P&L metric defined before the use case was built — purchase cost change, meetings booked, defect rate reduction, pipeline value generated. The CEO should see Phase 3 metrics. The implementation team tracks Phases 1 and 2.
How long does it take for AI to show measurable results in manufacturing?
Quality signals appear within 30–60 days of go-live — the team knows within the first month whether the AI output is trustworthy. Quantity signals appear within 60–90 days — adoption patterns stabilise. Commercial P&L signals appear within 4–6 months for well-designed use cases. The 12–14 month payback period documented for manufacturing AI reflects the full cycle: diagnostic, build, quality validation, quantity scaling, and P&L materialisation. Any vendor claiming P&L results in 8 weeks is measuring activity, not outcomes.
What is the difference between AI adoption metrics and AI success metrics?
Adoption metrics — users, sessions, tasks completed — measure whether the system is being used. Success metrics measure whether the use is producing commercial value. Adoption is a necessary condition for success, not a sufficient one. A system can have 100% adoption and zero P&L impact if the use cases are wrong, the data is not acted on, or the decisions it informs are not commercially significant. The CEO who reports adoption to the board is reporting the right thing at the wrong level. The board needs commercial outcomes.
Can AI success in manufacturing always be measured in exact ROI?
No — and the CEO who insists on exact ROI attribution before trusting a use case will almost always make the wrong call. In volatile commodity markets, AI-driven procurement improvements are real but unattributable to a single cause. In catalogue navigation use cases, the value is created through relationship compounding that does not appear in a single quarter’s numbers. The right approach: define the metrics before deployment, track them honestly, and use behavioural adoption as the proxy when external volatility makes precise attribution impossible. A tool that the management team cannot imagine operating without is creating value — even when the spreadsheet is ambiguous.
About StratAI
StratAI helps manufacturing firms in India build AI Advantage Systems. 10+ live deployments across textile, jewellery, furnishings, commodity processing, and component manufacturing. Official Registered Claude Partner and Anthropic Partner.
stratai.io/contact · palani@stratai.io · +91 99402 25924
“Measure quality before quantity. Measure quantity before ROI. And measure behaviour before anything else — because if it is not default behaviour, the ROI does not matter.” — StratAI